Printing production is no longer managed by instinct alone. Paper, ink, energy, labor, and machine time all influence the final margin. A delayed plate or a misaligned color sheet can quietly consume an entire day’s profit. This is why managers need to ask: what are the key metrics in printing production? The answer usually includes equipment effectiveness, makeready time, waste rate, production speed, on-time delivery, reprint frequency, and cost per finished unit.
Reliable data supports better decisions. The 2024 drupa Global Trends report identifies rising costs, skills shortages, and uncertain demand as continuing pressures across the printing industry. These pressures make operational visibility essential. A press may run at 15,000 sheets per hour, yet its real output may fall sharply after setup losses, stoppages, and quality checks. The Smithers report, The Future of Global Printing to 2028, also describes a market shaped by automation, digital workflows, sustainability demands, and tighter cost control. Metrics connect these pressures to daily action. They show whether a faster press truly improves profitability.
Numbers can still mislead. A high utilization rate may hide excessive overtime or poor maintenance. A low waste percentage may reflect underreported defects. Experienced teams should compare production data with physical samples, operator observations, and customer complaints. That combination is more trustworthy. Review the evidence carefully. Metrics are not the goal. They are practical signals for improving consistency, reducing avoidable waste, and protecting customer confidence in every production cycle.
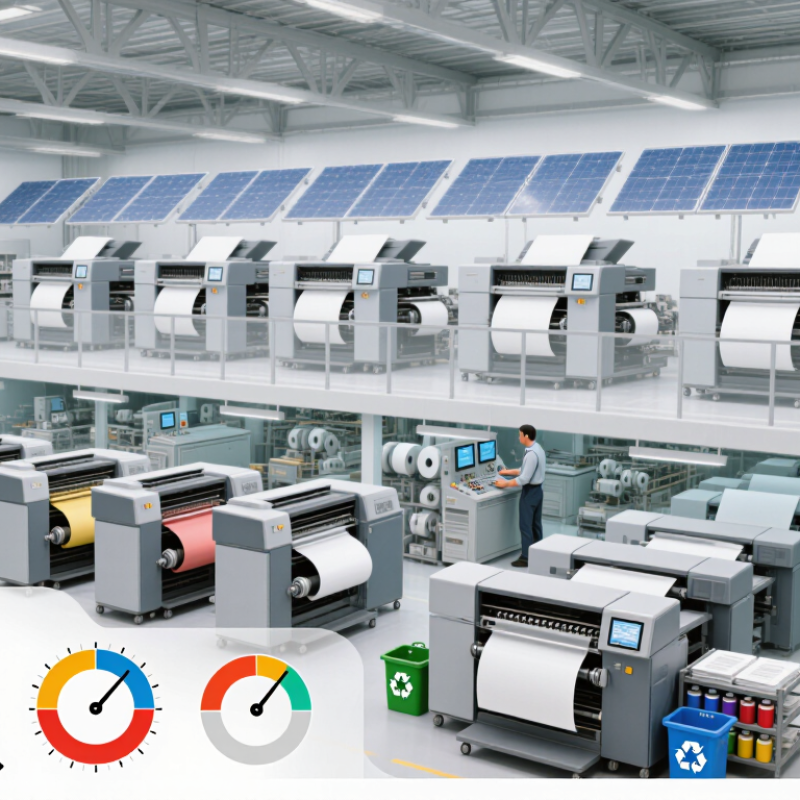
Key Metrics in Printing Production
Defining key metrics in printing production means turning daily activity into measurable evidence. A metric should answer one practical question. How quickly is each job completed? How often is it correct on the first run? What does one finished sheet really cost?
Common measures include turnaround time, first-pass yield, waste rate, machine uptime, and on-time delivery. Turnaround time tracks hours from approved artwork to dispatch. First-pass yield shows the percentage of jobs accepted without reprinting. Waste rate records spoiled sheets, ink, plates, and setup materials. These figures help supervisors locate delays near prepress, press setup, drying, or finishing. Clear definitions matter. Otherwise, two shifts may record the same problem differently.
Tips: Record units, time periods, and causes beside every number. Review a sample job manually each week. Do not trust a dashboard blindly.
A reliable metric needs consistent data and a clear owner. For example, uptime should separate planned maintenance from unexpected stoppages. Combining them may make performance look better than it is. I have seen teams focus heavily on output while overlooking rework and customer complaints. That approach feels efficient, but it can hide unstable quality. Metrics should also be compared with job type, paper size, color requirements, and order volume. A short digital run and a long packaging order cannot be judged fairly by the same target. Some definitions will need revision. That is not failure; it is evidence that production is being examined honestly.
Why Are Key Metrics Important in Printing Production?
Measuring Print Quality, Efficiency, and Material Usage
Print quality is more than a clean-looking sheet. Production teams should track color consistency, image registration, coating coverage, and visible defects. A trained operator can inspect samples under controlled lighting, while calibrated instruments verify density and color variation. Small shifts often appear before customers notice them. That early warning protects repeatability and reduces costly reprints.
Efficiency metrics show how smoothly a press or finishing line performs. Useful figures include setup time, running speed, unplanned stops, and accepted output per hour. A short setup may seem efficient, but frequent interruptions can reduce actual productivity. Record the reasons for downtime, not only its duration. The details matter.
Material usage needs equally careful measurement. Compare purchased substrate with acceptable finished output, including setup sheets, trim waste, and rejected copies. A low waste percentage can look impressive while hidden reprints remain unrecorded. That happened in one production review. The dashboard was accurate, but incomplete. Measurement timing can also distort results, especially when operators record waste after cleanup. Clear procedures, regular checks, and honest reporting create more reliable data. Still, no metric explains every production problem. Human judgment remains necessary when paper behavior, humidity, or complex artwork changes during a run.
Measuring print quality, production efficiency, and material usage helps teams identify process variation, reduce waste, and maintain consistent output.
Print quality represents the first-pass approval rate, efficiency represents overall equipment effectiveness, and material yield represents the percentage of input material converted into acceptable printed output. Higher values indicate stronger production performance.
A production dashboard is not decoration; it is an early-warning system. Experienced press operators compare planned speed with actual speed, then check waste, stoppages, and reprints. A falling run rate may indicate drying trouble, plate wear, substrate variation, or poor setup discipline. The number alone does not explain the cause. Context does.
Smithers’ The Future of Global Printing to 2028 estimates that digital print revenue will exceed 230 billion US dollars by 2028. This growth increases pressure to measure short runs accurately. Track setup minutes, sheets rejected, jobs delivered on time, and average machine utilization. If utilization falls below the internal target for three consecutive shifts, investigate before accepting more work. Small signals matter.
The 2024 Global Print Industry Survey reported that rising operating costs remain a major concern for print businesses. Waste data makes that concern visible. For example, a 3% rejection rate on a 100,000-sheet order means 3,000 sheets require replacement or rework. That cost is not limited to paper. It includes ink, energy, labor, and delivery risk. ISO 12647-based color checks can reveal drift before customers see inconsistent batches. Still, dashboards can mislead when operators enter data inconsistently. That is our uncomfortable gap. Measure fewer indicators, define each one clearly, and review the exceptions by job, shift, and material. Metrics should prompt questions, not hide them.
Using Metrics to Improve Costs, Workflow, and Sustainability
In a pressroom, metrics turn vague pressure into visible decisions. Track cost per thousand sheets, setup minutes, spoilage, reprints, and energy per job. These figures reveal where margins disappear. Smithers’ The Future of Global Printing to 2028 values the worldwide print market at roughly US$850 billion annually. Such scale makes small workflow losses financially meaningful.
A weekly dashboard should connect causes, not merely rank operators. If makeready rises from 18 to 25 minutes, supervisors can check scheduling, plate handling, or training. If spoilage falls by 2%, the saving should be verified against actual material purchases.
The U.S. Environmental Protection Agency’s Facts and Figures report recorded 46.9 million tons of paper and paperboard recycled in 2018. Waste is not only a sustainability issue. It is a cost signal.
Energy per saleable sheet links production choices with emissions. The International Energy Agency’s Energy Efficiency 2023 report states that industry uses about 37% of global final energy demand. A practical review can compare idle hours, dryer temperature, compressed-air leaks, and renewable electricity share.
Still, metrics can create false confidence. A low energy figure may hide slow output or defective sheets. I would audit definitions monthly. Perfect data is unlikely.
Applying key metrics turns continuous improvement into a daily production habit. The global digital-print market reached approximately $136.7 billion in 2023, according to a 2024 Smithers market report. It is forecast to reach $230.5 billion by 2028. This growth increases pressure on speed, consistency, and profitable customization.
On a production floor, teams should track make-ready time, first-pass yield, downtime, substrate waste, and energy per 1,000 sheets. Small changes matter. A ten-minute setup reduction can create extra capacity across several shifts. First-pass yield also exposes hidden rework that delivery reports may miss. ISO 12647-2 supports process control through measurable color and print-quality conditions. Operators can compare actual results against these targets, instead of trusting visual judgment alone.
Waste metrics need equal attention. European paper-industry data reported a recycling rate of 79.3% in 2022, but recycling should not excuse avoidable waste. Recording spoiled sheets by job, machine, and cause reveals patterns. A dashboard may look impressive while overtime quietly rises. That is worth questioning. Continuous improvement works better when supervisors review metrics with operators, not only after monthly failures. Targets should be adjusted when order sizes, materials, or customer requirements change. Rigid targets can create the wrong behavior. Use the numbers, but inspect the production floor too.
Track color consistency, image registration, coating coverage, and visible defects. Inspect samples under controlled lighting. Calibrated instruments can confirm small color shifts.
Human judgment can miss gradual changes. Instruments reveal density and color variation earlier. Still, equipment does not understand every artwork problem.
Record setup time, running speed, unplanned stops, and accepted output per hour. A fast press may still lose time through repeated interruptions.
Duration alone hides useful details. Note plate handling, scheduling, maintenance, or operator issues. The cause matters more than a large red number.
Compare purchased substrate with acceptable finished output. Include setup sheets, trim waste, rejected copies, and reprints. Measure before cleanup changes the evidence.
Yes. Hidden reprints may remain outside the calculation. The dashboard can look accurate but still be incomplete. That deserves a second review.
Track cost per thousand sheets, setup minutes, spoilage, reprints, and energy per job. Compare savings with actual purchases. Claimed savings need proof.
Measure energy per saleable sheet or per 1,000 sheets. Check idle hours, dryer settings, air leaks, and electricity sources. Low energy may hide slow output.
Review make-ready time, first-pass yield, downtime, waste, and energy regularly. Discuss results with operators. Rigid targets can create the wrong behavior.
No single metric explains every production problem. Paper behavior, humidity, and complex artwork can change results. Perfect data is unlikely. Inspect the floor, too.
Key metrics in printing production provide a clear way to evaluate print quality, operational efficiency, and material usage. The question “what are the key metrics in printing production” can be answered by examining indicators such as color consistency, defect rates, production speed, equipment utilization, waste levels, and material consumption. Together, these measurements show whether a production process is meeting quality and output expectations.
By reviewing performance data regularly, printing teams can identify problems such as recurring defects, workflow delays, excessive setup time, or inefficient use of ink and paper. These insights support better cost control, smoother scheduling, and more sustainable resource management. Metrics also help teams compare actual performance with production goals and make informed adjustments. When tracked consistently, key metrics create a foundation for continuous improvement, helping printing operations become more reliable, efficient, cost-effective, and environmentally responsible over time.

Vector Print