Buying a digital press is not just a production decision; it commits a business to new capacity, workflows, and ongoing costs. Smithers’ report, The Future of Digital Printing to 2032, estimated the market for digitally printed products at $167.5 billion in 2022. It forecasts growth to $230.5 billion by 2032. That market outlook signals opportunity, not guaranteed profit. A press can sit idle while financing, service, and software costs keep accumulating. The details matter.
For owners comparing equipment, how to calculate ROI for digital printing systems starts with real production data, not a vendor’s best-case estimate. Measure purchase and installation costs against expected savings and added contribution margin. Include ink or toner, click charges, labor, maintenance, energy, finishing, waste, and downtime. Then compare those costs with the work the machine can realistically win or move in-house. A short-run job with variable data may suit digital production; a long, stable run may not. Track monthly volume, spoilage, and actual press utilization. Be honest about assumptions. Sales forecasts are often the weakest part of the model, and one unusually strong month can distort results. A payback estimate helps, but it cannot capture every operational risk. The goal is a transparent calculation that managers can revisit as job mix and costs change. Industry reports provide context; your own invoices, production logs, and service records provide the evidence.
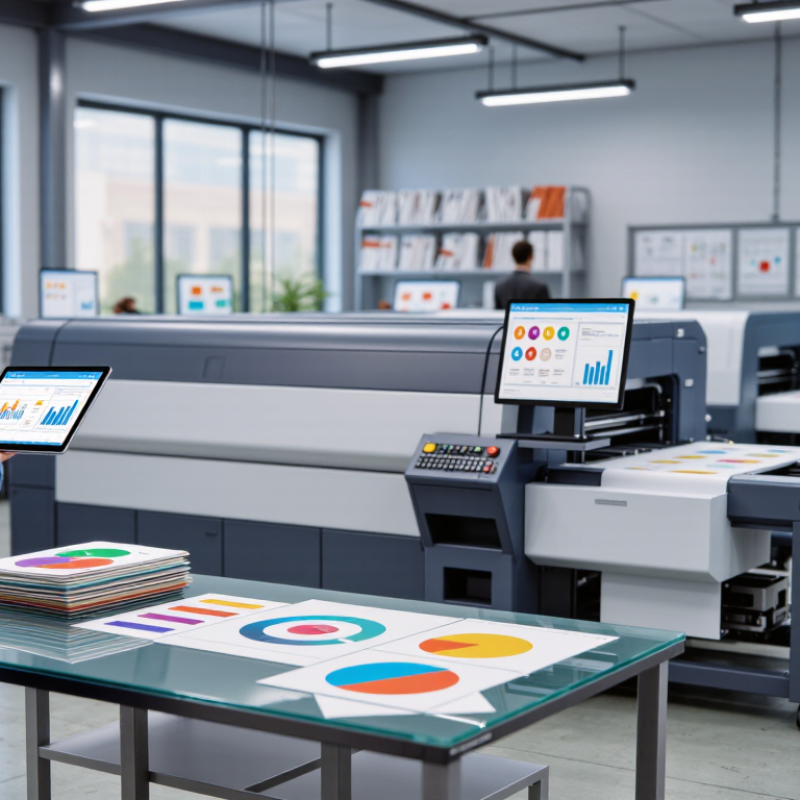
Defining ROI for digital printing systems starts with a clear question: what financial return does the investment produce over a defined period? A common calculation is (financial benefits minus total costs) divided by total costs, multiplied by 100. The result is useful only when both sides are measured consistently. Costs may include the equipment, installation, workflow integration, operator training, ink, media, maintenance, and financing. Benefits should reflect measurable gains, such as contribution margin from additional jobs, reduced outsourcing, less setup waste, or lower labor time. Revenue alone can mislead. A busy press is not automatically a profitable one.
Choose a time frame that matches the decision, such as three years, and compare the same period’s costs and benefits. Use job records, invoices, waste logs, and labor estimates rather than optimistic projections. For example, track how many short-run jobs move in-house and what each job contributes after materials and labor. Avoid counting the same saving twice. Keep assumptions visible, too. A spreadsheet can look cleaner than the shop floor. Our first estimate may miss reprints, downtime, or the time required to train operators. That is not a reason to abandon the calculation; it is a reason to update it with actual production data.
ROI = (cumulative benefits − initial investment) ÷ initial investment × 100. This illustrative example assumes a $120,000 system investment and $48,000 in annual measurable benefits, such as reduced production costs and additional contribution from jobs. Actual results vary; these figures are not an industry benchmark.
Under these assumptions, cumulative ROI reaches 0% during Year 3 and 60% by the end of Year 4. Include only benefits and costs relevant to your operation when evaluating a system.
A credible return-on-investment estimate starts with the full cost of getting a digital printing system ready for production. The purchase price is only one line. Include delivery, installation, electrical work, ventilation, and any room modifications. Add software licenses, workflow setup, operator training, and the time spent testing color and registration. Small setup costs add up.
Then estimate recurring expenses against realistic job volumes. Track ink or toner, print media, cleaning supplies, replacement parts, service visits, and energy use. Include labor for file preparation, machine operation, finishing, and quality checks. A printed sheet is not always a finished product. Trimming, folding, or binding may require separate equipment and staff time.
Downtime matters, too. A machine waiting for a part can delay orders or push work to another process. Record typical maintenance hours and the cost of missed production, but avoid treating every interruption as predictable. Estimates are imperfect. Paper waste, reruns, and seasonal workload changes can distort the first calculation. Compare assumptions with invoices and production logs after several months, then revise them. That review is easy to postpone. Don’t.
ROI for a digital printing system is more than comparing its purchase price with sales. A practical calculation includes installation, software, training, service, financing, and consumables. Then compare these costs with added contribution margin and measurable savings. Track setup minutes, labor hours, waste, uptime, and jobs completed per shift. Small improvements can matter. A few minutes saved on every short run may free capacity for another job.
Industry figures provide context, not a promised return. FESPA’s 2023 Print Census, drawing on 1,778 respondents across 120 countries, reported that 53% expected sales to increase over the following two years. Grand View Research estimated the global digital printing market at USD 34.3 billion in 2023 and projected a 6.7% compound annual growth rate through 2030. Neither figure proves that a specific press will pay for itself. They do show why print providers should test investment assumptions against real demand.
Use a baseline from recent production records, then compare it with results after installation. For example, record makeready time, spoilage, overtime, and on-time delivery for similar jobs. Calculate payback using net annual benefit, not gross revenue. Be cautious with forecasts: staff learning, uneven workloads, or service delays can weaken early results. One honest limitation belongs in every ROI model. Expected savings may not appear on schedule.
Comparing digital printing systems by ROI means looking beyond purchase price. One system may cost less upfront, while another handles short runs with fewer setup steps. That difference matters when orders change daily. Small jobs matter. A printer that reduces setup time can free staff for finishing, quality checks, or urgent work.
Use the same assumptions for each system. Estimate annual print volume, average job size, consumables, maintenance, labor, and expected downtime. Then compare those costs with revenue from completed work, not just machine speed. A faster system may bring little return if it sits idle. Track waste, too: test prints and misfeeds can quietly erode margins. Ask suppliers for sample runs using your own files and materials. Record actual output and finishing time.
A simple payback estimate is useful, but it is not the whole picture. Include training, service response, and the cost of keeping older equipment in use. A tidy spreadsheet can still miss seasonal demand or awkward job changes. That is worth revisiting. Compare cautious, expected, and busy-period scenarios, then check the figures against production records after installation. Real results may differ from the estimate, especially during the learning period.
ROI should guide an investment decision, not make it automatically. For a digital printing system, compare its purchase and setup costs with likely gains in labor, materials, and production time. Use your own order history, not a supplier’s best-case example. That matters.
For instance, estimate how many hours staff spend on setup, color adjustments, and repeat jobs each month. Then compare current costs with realistic figures for the proposed system, including ink, maintenance, training, and expected downtime. A shorter turnaround may also help retain customers, but count that benefit only when records support it. Keep the assumptions visible.
Use the results to compare options and test different workloads. Calculate payback under conservative, expected, and high-demand scenarios. If the system only pays off when every shift runs at full capacity, the investment may be fragile. Some estimates will be wrong; that is normal. Review them against actual production data after installation, especially waste rates and utilization. A spreadsheet can look precise while hiding uncertain assumptions. Be willing to revise the plan when the shop’s real numbers disagree.
Subtract total costs from financial benefits, divide by total costs, then multiply by 100. Use the same time period for both. Keep the assumptions visible.
Include equipment, delivery, installation, electrical work, software, workflow setup, and operator training. Add ink, media, maintenance, energy, financing, and labor. Small costs add up.
Track added contribution margin, reduced outsourcing, less setup waste, and lower labor time. Revenue alone can mislead. A busy press may not be profitable.
Record setup minutes, waste, uptime, labor hours, and completed jobs per shift. Compare similar jobs before and after installation. Look closely at short runs.
Use realistic job volumes and production records. Include consumables, cleaning supplies, replacement parts, service visits, and finishing labor. A printed sheet may still need trimming or binding.
Downtime can delay orders, reduce production, or shift work elsewhere. Record maintenance hours and missed production costs. Not every interruption is predictable.
Choose a period that fits the decision, such as three years. Compare costs and benefits across that same period. Review actual results after several months.
Reprints, training time, uneven workloads, waste, and service delays can reduce early returns. Our first estimate may miss something. Revise it using invoices and production logs.
Understanding why to calculate ROI for digital printing systems helps businesses determine whether an investment can deliver meaningful value. The process begins by defining ROI and identifying the full cost of ownership, including equipment, installation, materials, maintenance, labor, and workflow changes. A clear cost picture makes it easier to assess the investment realistically rather than focusing only on the purchase price.
To measure returns, consider both financial gains, such as reduced production costs and increased revenue, and operational improvements, such as faster turnaround, less waste, and greater flexibility. Comparing systems using consistent assumptions can reveal which option offers the strongest overall value. Learning how to calculate ROI for digital printing systems also helps decision-makers test different scenarios, understand payback expectations, and connect the results to business priorities. ROI should guide investment decisions alongside practical needs, risks, and long-term growth plans.

Vector Print